

Parallel Seiesmic
More about the method
Overview
PSI uses the well-known Parallel Seismic method to establish the depth of existing foundations (specifically for a pile or deep foundations) where the superstructure (i.e. existing building) precludes access to the pile heads.
The test requires the installation of a plastic access tube in parallel, and as close as possible, to the tested pile. The tube should be carried down to a depth exceeding the assumed pile length by a margin of 8m-10m and filled with water. In unsaturated soils, the tube should be firmly grouted in the hole to achieve good coupling with the surrounding soil.
PSI2 is compliant with the following standards:
AFNOR NF P94-160-3 and ASTM D8381-21

The PSI
Paralle Seiesmic Instrument
by Piletest
Method basic operation
Parallel Seismic involves striking any part of the structure connected to the pile or foundation (or hitting the foundation itself, if accessible) and receiving compressional and/or shear waves traveling down the foundation by a hydrophone receiver.
In parallel seismic testing, one relies on identifying direct arrival times of compressional and shear waves at the receiver locations, as well as the wave amplitudes.
The parallel seismic sampling is performed at 0.3-0.6m vertical receiver intervals in the access duct parallel to the pile. The field setup for parallel seismic measurement is shown in Figure 1. Includes:
-
Measurement and analysis unit
-
Trigger hammer to generate the compression waves
-
Depth meter - To signal the location of the hydrophone sensor
-
Received wave sensor - Hydrophone
Method requirements and limitations
To generate the compressional and shear waves in the foundation pile, a portion of the structure connected to the foundation pile must be exposed for the hammer impacts. A borehole with a plastic tube filled with water is required for lowering the receiver. The pipe is typically 5-10 centimeters in diameter, and it is drilled as close as possible to the foundation (up to 1 meter away). In very uniform soils (such as saturated sands), a successful test can be performed with up to 4.5-6m spacing between the source and the borehole.
The minimum pile length is about 5 meters, and the parallel borehole should extend at least 3 meters below the expected bottom of the pile foundation. With a hydrophone, the pipe must be cased, capped at the bottom, and the casing and hole filled with water.
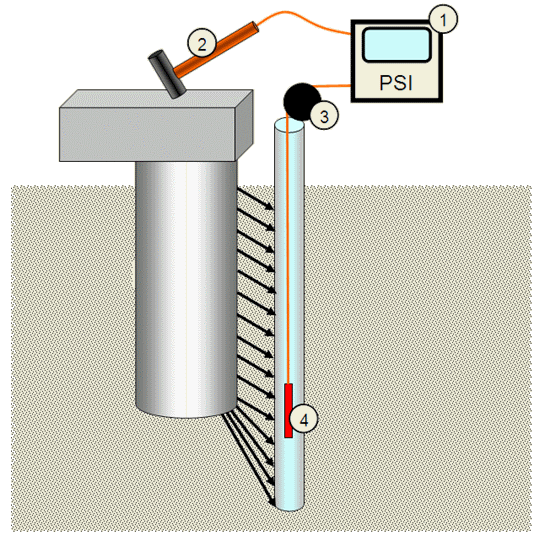
Figure 1 - Parallel Siesmic system components
Processing the information
To be able to make a good analysis of the information, an AGC (Automatic Gain Control) for good constant signal level must be used, and signal filtering before sampling and digital filtering after sampling of the received digitized signal, which helps to determine the bottom of the foundation pile (i.e., the pile length).
The diffraction, or change in slope, that occurs in the data as a result of the pile tip acting as a point diffractor and a reflector is shown in Figure 3. The software can determine velocity based on the slope of the line, and where the two lines of the differing slopes intersect, a length is determined.
Method virtue
The parallel seismic NDT method is more accurate and versatile than other non-destructive surface techniques for determining unknown foundation depths. The method's accuracy depends on the variability of the velocity of the surrounding soil and the spacing between the borehole and the foundation element.
However, unlike PEM or Crosshole (CSL) methods, it does not determine the integrity of the pile.
Length is typically determined within 0.5m accuracy or better.
The parallel borehole needed for the Parallel Seismic tests adds to the cost of the measurement.
The borehole should be within 1m of the foundation, which sometimes cannot be achieved due to field constraints.
As the borehole is further from the foundation, the interpretation of the PS data becomes more complex, and the uncertainty in the length determination becomes more significant as the signal-to-noise deteriorates and the wavefront becomes wider.
Downloads

Figure 2 - Received signal before filtering and analysis

Figure 3: First analysis of the result
Figure 4: After additional digital filtering of the results